I've recently needed to remotely debug a WCF service hosted in a Test (QA) environment, as the described issue was not reproducible in my local workstation. After having read the
MSDN, and referring to some Youtube materials, I could configure the remote debugging tools.
First, you need to download the matching remote debugging tools set to your Visual Studio version.
Latest version for VS 2015 :
Remote Tools for Visual Studio 2015 Update 3
Latest version for VS 2013 :
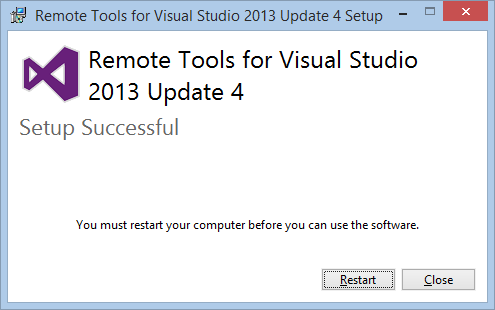
Remote Tools for Microsoft Visual Studio 2013 Update 4
You have to download and install the matching bit version (x86/x64) package on the remote server where your service is hosted (not in the PC where the source code and Visual Studio is installed) . When the setup is completed, you might be asked to restart the server.
You will get this icon into your desktop.
Then run this with Administrative privileges (
Run As Administrator).
Now go to Tools => Options Set the Authentication mode to "No Authentication" and check the "Allow any user to debug". and click on OK.
If your port 4018 is blocked, you have to open the port from the Windows firewall. Before switching back to the workstation pc, you have to copy the
pdb files which match the application build version currently running in the remote server. If you have control of the remote server, my advice is to rebuild your application in debug mode and copy the build assemblies along with the pdb files into the remote server. If you do so, you will have more information and control while you are debugging the code.
Now switch back to your workstation PC where you have the Visual Studio and the source code.
Open up your project (if you haven't) Go to Visual Studio options and uncheck Enable Just My Code option.
If you need to debug the referenced libraries, you can configure the Symbols and cache them to a local folder to speed up your next debugging session.
Now go to Debug > Attach to Process
Then select "Remote" from Transport drop down, and click on "Find..."
Your remote server details will be shown if your remote server is on the same subnet as your workstation. If your remote server is outside your subnet you have to type the full hostname along with the remote debugging port (Ex: MyRemoteServer.mydomain.com:4018) and you have to make sure the firewall on this server allows TCP traffic to the specific port.
When you select the remote host, you will get the list of running processes on the remote server. Make sure you have clicked "Show processes from all users".
Select w3wp.exe process and click on Attach. If multiple instances of the w3wp process are shown, you can pick the correct one by referring to the username column. if it is not shown, you have to access the service URL from your browser/WCF test client or directly from the remote server IIS to activate the service.
Now you can place your breakpoint on your code and run your application. You will be able to debug line by line with variable values. (Note: Variable values might not appear if you haven't copied the pdb files into your server location or pointed at the Symbol file (.pdb) location).